



Ask a manager in a mid-sized UK business where the gross margin figure on page four of the board pack came from, and the usual answer is the name of a report, or the name of the person who built it. Ask what the figure includes and what it leaves out, and the answer gets vaguer. The business has the data. It has more reports than it had three years ago, and still nobody at the table can trace that one number back to the sales ledger and the cost file it was built from. So the discussion moves on to something easier and the decision waits another month.
Oracle set out to measure that kind of deferral in its Decision Dilemma research in 2023, which covered 14,250 business leaders and employees across 17 countries. Seven in ten said they had abandoned a decision because the data in front of them was too much to work through. Eighty-six per cent said the growing quantity of data had made decisions in their organisation more complicated, and just over a third admitted they did not know which of their sources they could trust.
Why another dashboard rarely settles it
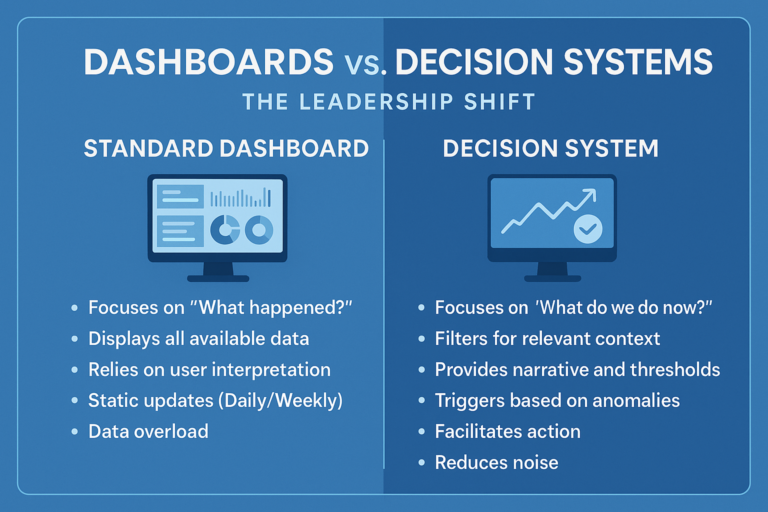
The standard response to a slow decision is to commission a better report. Someone in finance or IT is asked to pull the figures together in one place, a new Power BI page appears, and for a few weeks it gets attention. Then a director notices that the revenue total on the new page differs from the one in the sales team’s own report by a few thousand pounds, and the old uncertainty comes back with an extra page attached.
Both totals can be correct. One may include credit notes and the other may not, or one may count revenue on invoice date while the other counts it on delivery date. A dashboard shows the result of those choices without showing the choices themselves, and a reader who cannot see the choices has no way to settle the disagreement except to ask whoever built the report. If that person has left, or is on leave, or built it eighteen months ago and cannot remember, the number sits there unresolved. Each additional dashboard adds more of these unresolved numbers. What shortens the argument is having more people at the table who have been taught how the working behind the chart is done.
The confidence shortfall is specific
Qlik’s data literacy research, covering 1,209 executives and 6,197 employees, found that only 11 per cent of employees described themselves as fully confident in their ability to read, work with and argue with data. Read alongside the Oracle findings, that goes some way to explaining the deferrals. A manager who is unsure how to read a chart is unlikely to challenge it, and a chart that nobody challenges never gets corrected.
The confidence that matters here has three parts. There is the confidence to read a report and know what each figure is counting. There is the confidence to question it when it looks wrong, in front of colleagues. And there is the confidence to build a simple figure of your own when the one you need has not been built yet. Most management teams have the first in some measure. Far fewer have the second and third, and those two are what shorten a decision, because they let the people responsible for the outcome check the evidence themselves instead of waiting on someone else’s diary.
A manager does not have to become an analyst. Understanding how a figure is assembled, at about the level a competent spreadsheet user understands a SUMIF, covers most of it.
What changes when a manager builds a measure
Power BI, Microsoft’s reporting tool, defines the figures on a report with a formula language called DAX (Data Analysis Expressions). Each defined figure is called a measure. A measure for gross margin percentage is one line that divides margin by revenue; a measure for year-to-date sales is one line that tells Power BI which dates to count. Once the data is in place, writing either takes a few minutes, and the first time a manager does it, every other figure they are shown starts to look like something that could be checked.
Someone who has written a year-to-date measure knows that it depends on a calendar table and a date column, so when two reports disagree about year-to-date sales their first question is which date each one uses, and that settles it. Someone who has built a margin measure knows whether rebates and freight were included, because they had to decide. The boardroom conversation moves on to “what does this number include”, which has an answer that can be checked, and the long argument about whose figure is right tends to stop happening.
It changes what managers ask for, too. Rather than requesting a new dashboard, they ask for a new measure on an existing one, or add it themselves on a Tuesday afternoon. Requests to the data team get smaller and more precise. The reports that already exist get more use, because the people reading them know what they are looking at.
What good training produces
The test of a Power BI course for managers is whether, a month later, the attendee can answer “where did that figure come from” without emailing someone. That means naming the source system, describing what was filtered out when the data was cleaned, saying which tables are joined and on what, and explaining the measure in a sentence. Anyone who can do that for one report can learn to do it for the rest.
Getting people there takes hands-on work, because none of it sticks when it is only watched on slides. The course has to cover connecting to data in Excel, a database or a cloud service; cleaning and reshaping it in Power Query, the part of Power BI that handles the tidying; building a data model so a figure means the same thing on every page; writing DAX measures, including the time-intelligence functions behind year-to-date and prior-period comparisons; designing a report other people will read; and publishing it to Microsoft 365 with each reader seeing only the rows they are allowed to see. Red Eagle Tech runs a live two-day version of exactly this kind of course, delivered over Microsoft Teams so anyone in the UK can join, in small groups at £600 plus VAT per person. Its seven modules follow that sequence in order, beginning with the basics and finishing with deployment, with each topic demonstrated and then built by the attendee on real datasets. The trainer has led Power BI training across a FTSE 100 company, and the firm, a Microsoft Partner that Clutch named a Top Power BI and Data Solutions Company in London for 2026, has trained more than 200 people on it.
Two days gets a manager to the point of building and defending their own measures. Deeper DAX skill comes with use afterwards, and any course that promises expertise in that time deserves some scepticism.
A sensible first step
Start smaller than a programme. Pick one decision that has been deferred more than once, find the figure that keeps being argued about, and send the manager who owns that decision on a course, along with the analyst who built the report if there is one. Sending the manager matters more. The analyst can already build the measure; the shortfall is in the room where the decision gets taken.
When they are back, have them rebuild that one contested figure as their own measure, built directly on the source data, and put it beside the existing one. If the two match, the business has a number it can stop arguing about. If they differ, the difference will point to a definition nobody had written down, and it is far better to find that in a working session than halfway through a board meeting.
For a manager who wants a formal qualification afterwards, Microsoft’s PL-300 exam covers the same ground, and a UK guide to the PL-300 certification sets out the cost, the format and how to book. Most will not need it. The first sign that the training has worked is a small one: the next time somebody asks where the margin figure came from, the person who owns it names the ledger, the date column and the two things the measure leaves out, and the meeting carries on.
